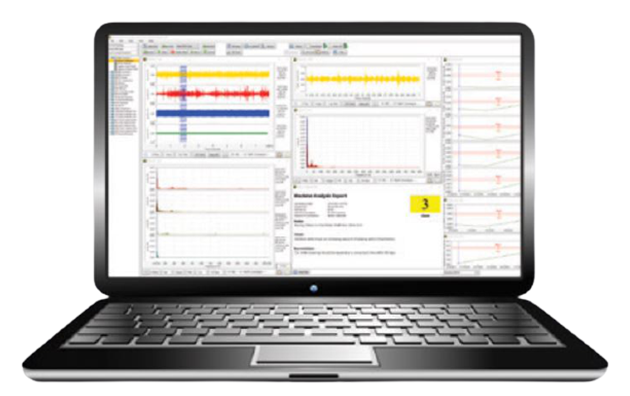
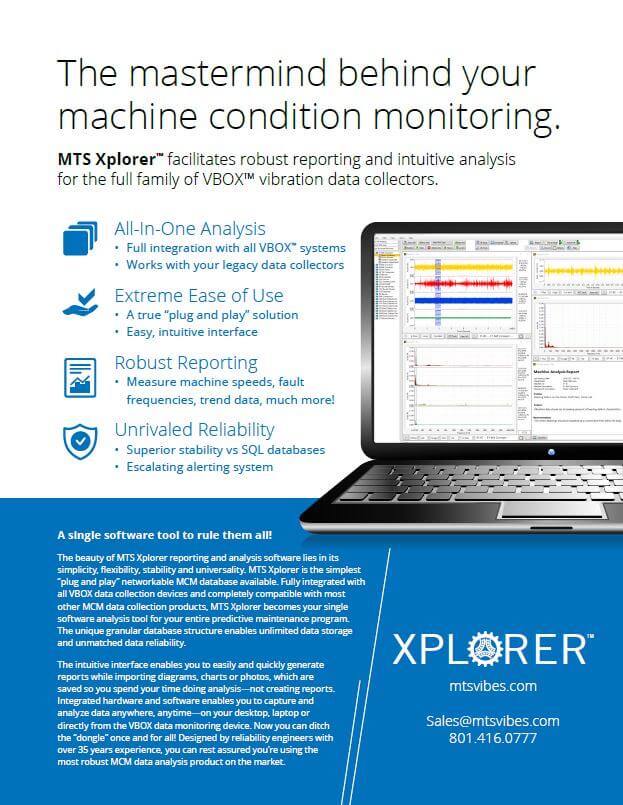
MTS Xplorer Analysis Strategy
The Vbox series of data collectors are based on the fact that data collection rates are determined by the frequency range which is measured by an accelerometer which is mounted with a magnet. The usable frequency range transmitted through a magnet is around 8000 Hz. The data collection rates are established based on the filtering effect of the magnet.
The next strategy used is that the full-time waveform of is collected and stored usually with a duration of 5 to 10 seconds. With this dataset in hand, the need to acquire additional data to complete the analysis and reporting almost goes completely away.
This plot shows history over a 6 month period. Each waveform contains about 150k samples and has been filtered to only display data from 0Hz to 1000Hz.
The corresponding Fast Fourier Transform (FFT) plots are shown below limited to a frequency range of 1000Hz resolution of the each plot is 8500 lines.
The final step is to post process from the stored time waveform, the spectrum, trend values, high-resolution spectrum up to 85,000 lines, averaged spectrum – lower resolution, apply filters of choice, low pass, high pass or band pass, select display range both amplitude and frequency to see specific content, use demodulation, order analysis, English or Metric units, “play” the waveform as audio and “listen” to the vibration, add fault frequencies from the bearings and gear sets.
Easily generate the report, include any displayed graph, spell check the analysis, print it, save it as a pdf, spend your time doing analysis not creating the report.
85,000 line spectrum
Zoom in spectrum 3700 Hz to 3800 Hz
No timewaveform filter
Timewaveform low pass filter 0 to 2000 Hz
Timewaveform band pass filter 3700 Hz to 3800 Hz
Timewaveform high pass filter 3700 Hz 8500 Hz
Vibration Audio